I have noticed that US based (and some Nordic) investors are mostly focused on what is going on in their domestic large-cap space. As the S&P 500 keeps on soaring some may not be fully attuned with the state of the global markets and the risks they pose. At the same time as the S&P 500 is doing great, the global equity markets, US small-cap stocks and commodities have imploded, or are in the process of imploding. Most markets are in or entering into bear market territory. In my perception this fact makes the ongoing S&P 500 bull vs. bear debate obsolete as it is only a matter of time before the S&P 500 which is highly correlated with international markets (graph #1) starts to move lower.
Graph #1: S&P 500 correlation with international equities 2010 - 2015
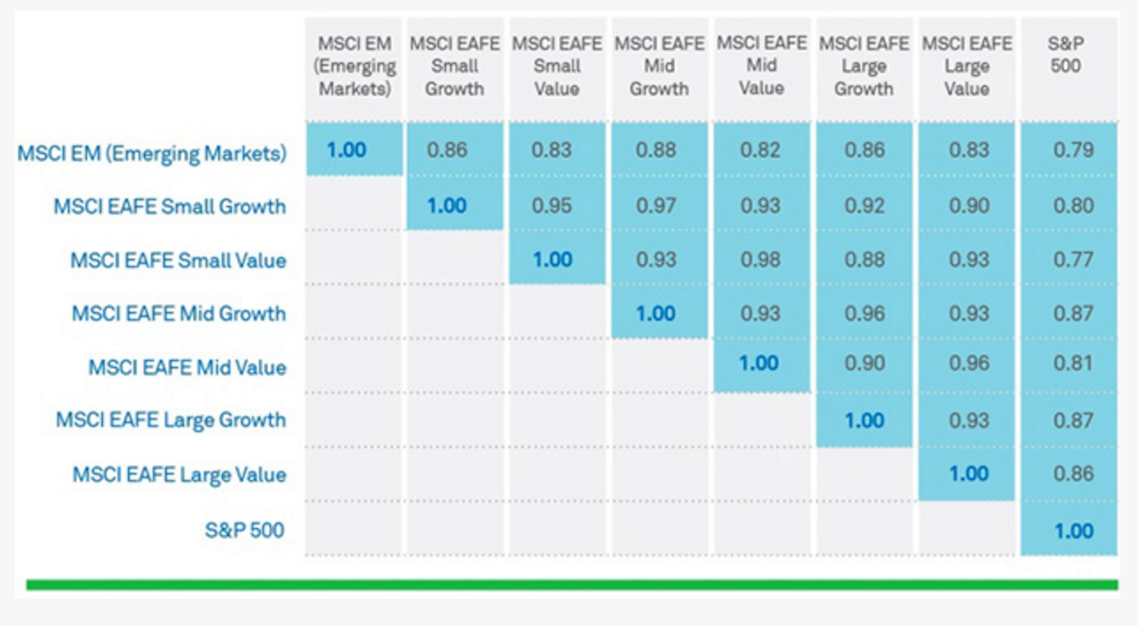
Source: BNY Mellon
In my humble opinion the post 2008 - 2009 credit buildup/ business cycle has ended. The credit buildup has even ended for US stocks as reflected in the demand for US margin debt (graph #2). I have been told that the S&P 500 is a safe heaven index where I can stash my cash. I do not believe that stocks can ever be a safe heaven.
Graph #2: Margin Debt & S&P 500 Discrepancy
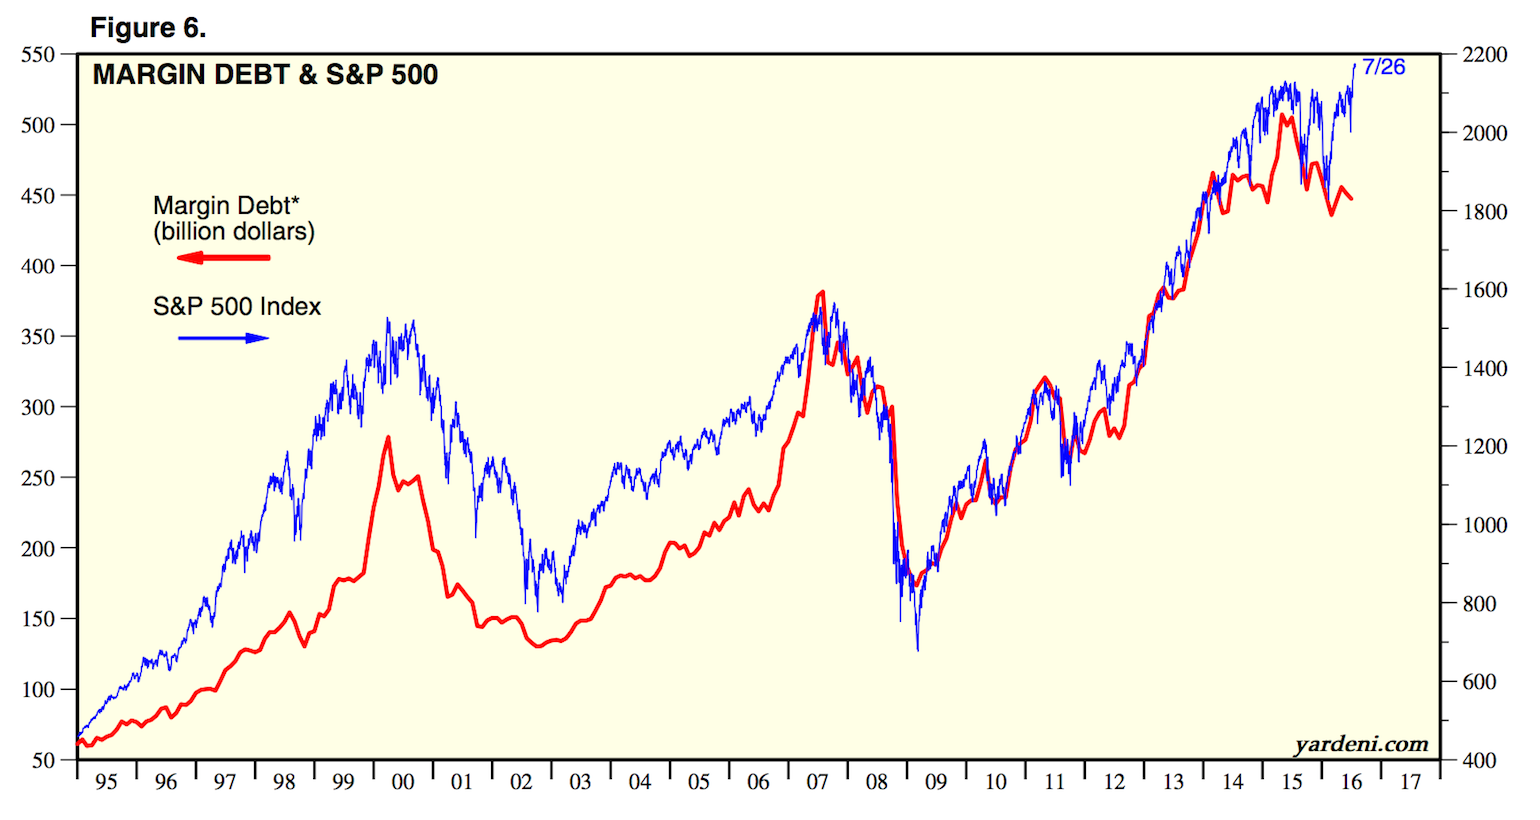
Source: Yardeni Research
The German DAX is currently 17 % down from its 2015 peak, the Japanese Nikkei 225 is down by 20 %, the Chinese Shanghai Composite is down by 40 % and brent oil is down by 64 % from its 2014 peak. Furthermore the US small-cap index Russell 2000 is down by 5 % from its 2015 peak (I am short Russell 2000).
The only reason some investors believe that the markets are fine is due to the fact that the S&P 500 have not yet started to trend downward. The US large-cap stocks are still holding up mainly due to what I perceive to be record low unsustainable interest rates combined with a chase for "safe heaven" yields while both economic activity and earnings are deteriorating in the US and abroad. During a normal business cycle the S&P 500 will perform very well post the FED starting to rise interest rates. At this point I would not bet on the average historic appreciation (graph #3) as the FED started rising rates at the end of 2015, a couple of years too late. It is my perception that they started rising rates at the end of the business cycle, not in the middle of the business cycle as usual.
Graph #3: Stocks performance before and after first FED rate hike
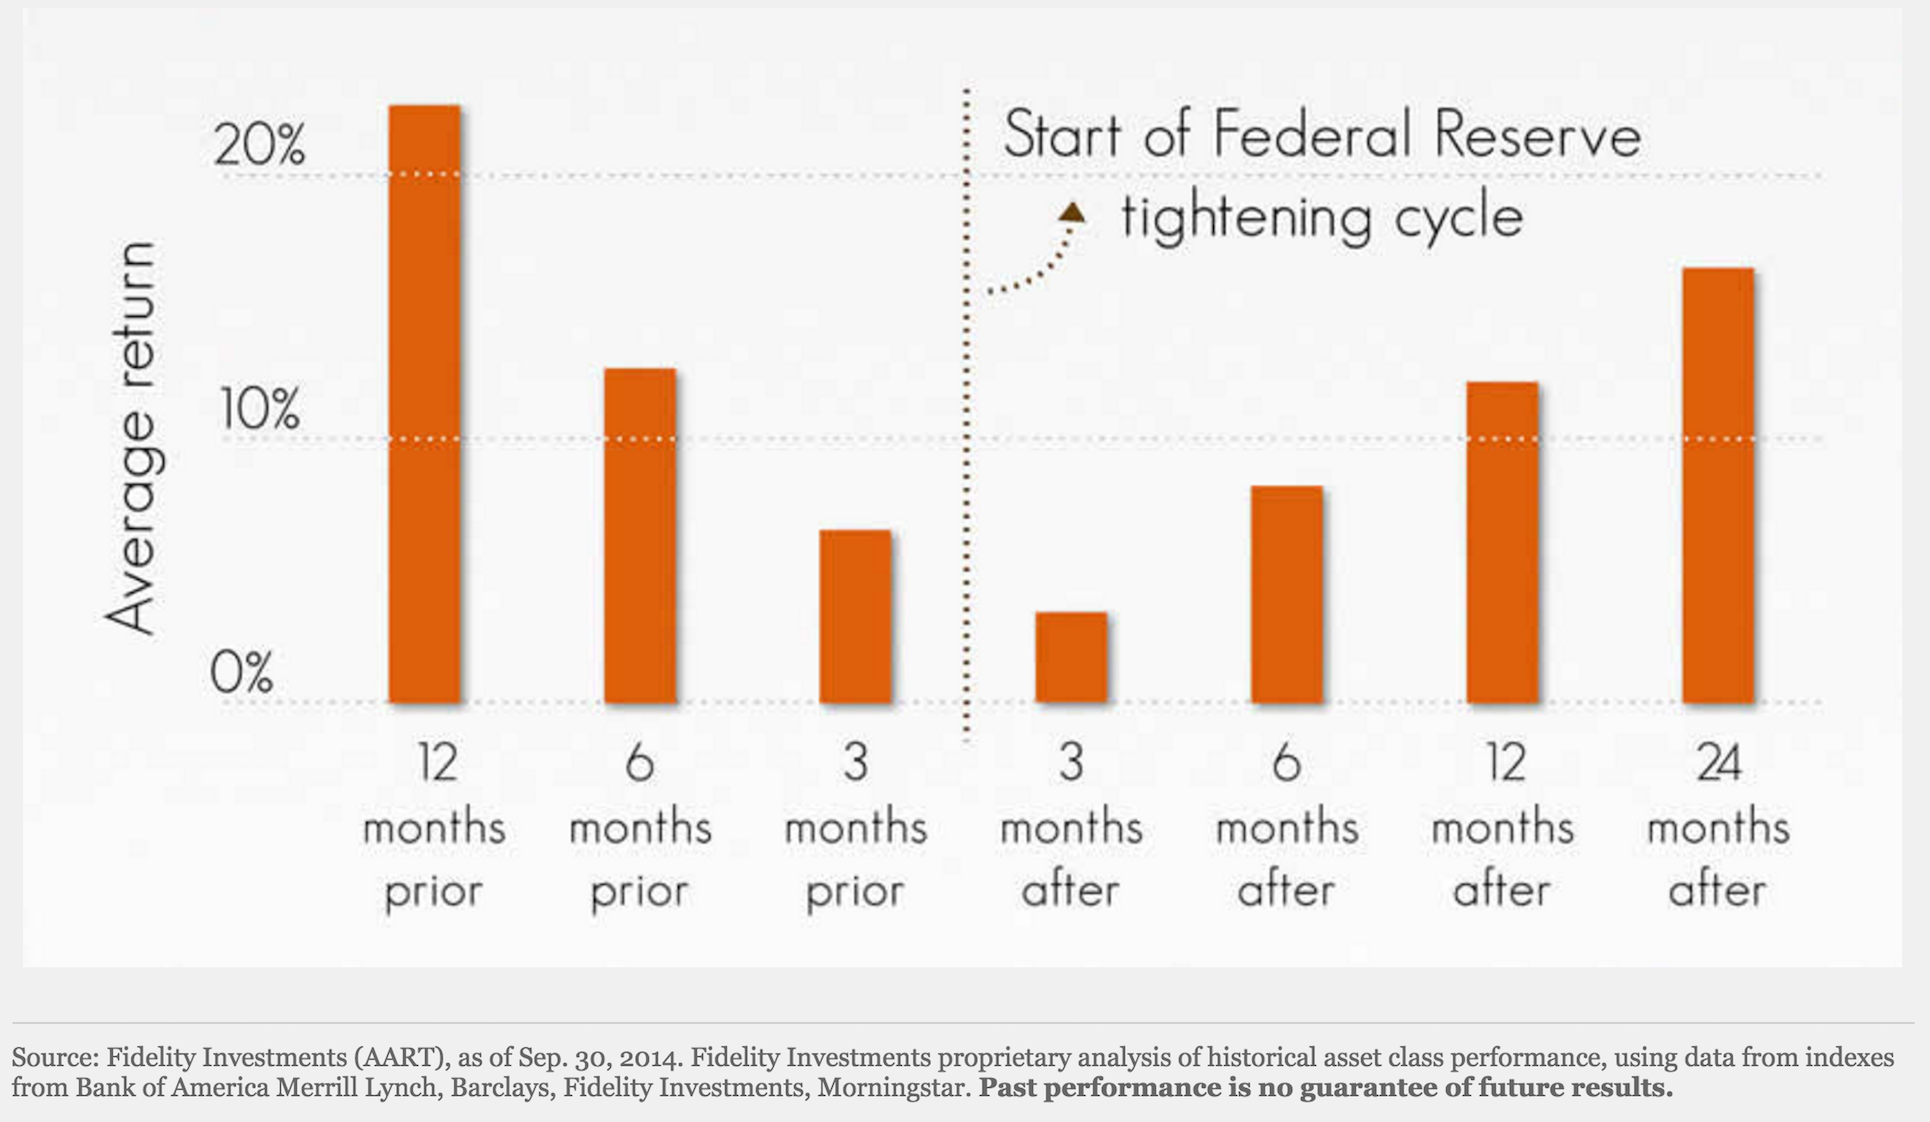
Source: Fidelity Investments
I believe that the day of reckoning will be here soon enough for the S&P 500. The index will at some point start to trend downwards alongside its international counterparts. Both the S&P 500 Shiller PE multiple and the market-cap to GDP ratio currently are at or above pre financial crisis levels (graph #4 and #5). The rich valuation is combined with an ongoing earnings recession (graph #6). The S&P 500 is clearly in a bubble. Furthermore the downtrend in international market will at some point catch up to the S&P 500 bubble index. In bad times global indexes start to correlate more than normal. I do not believe that it will be different this time around (graph #7).
Graph #4: S&P 500 Shiller PE Multiple @ Pre Financial Crisis Level
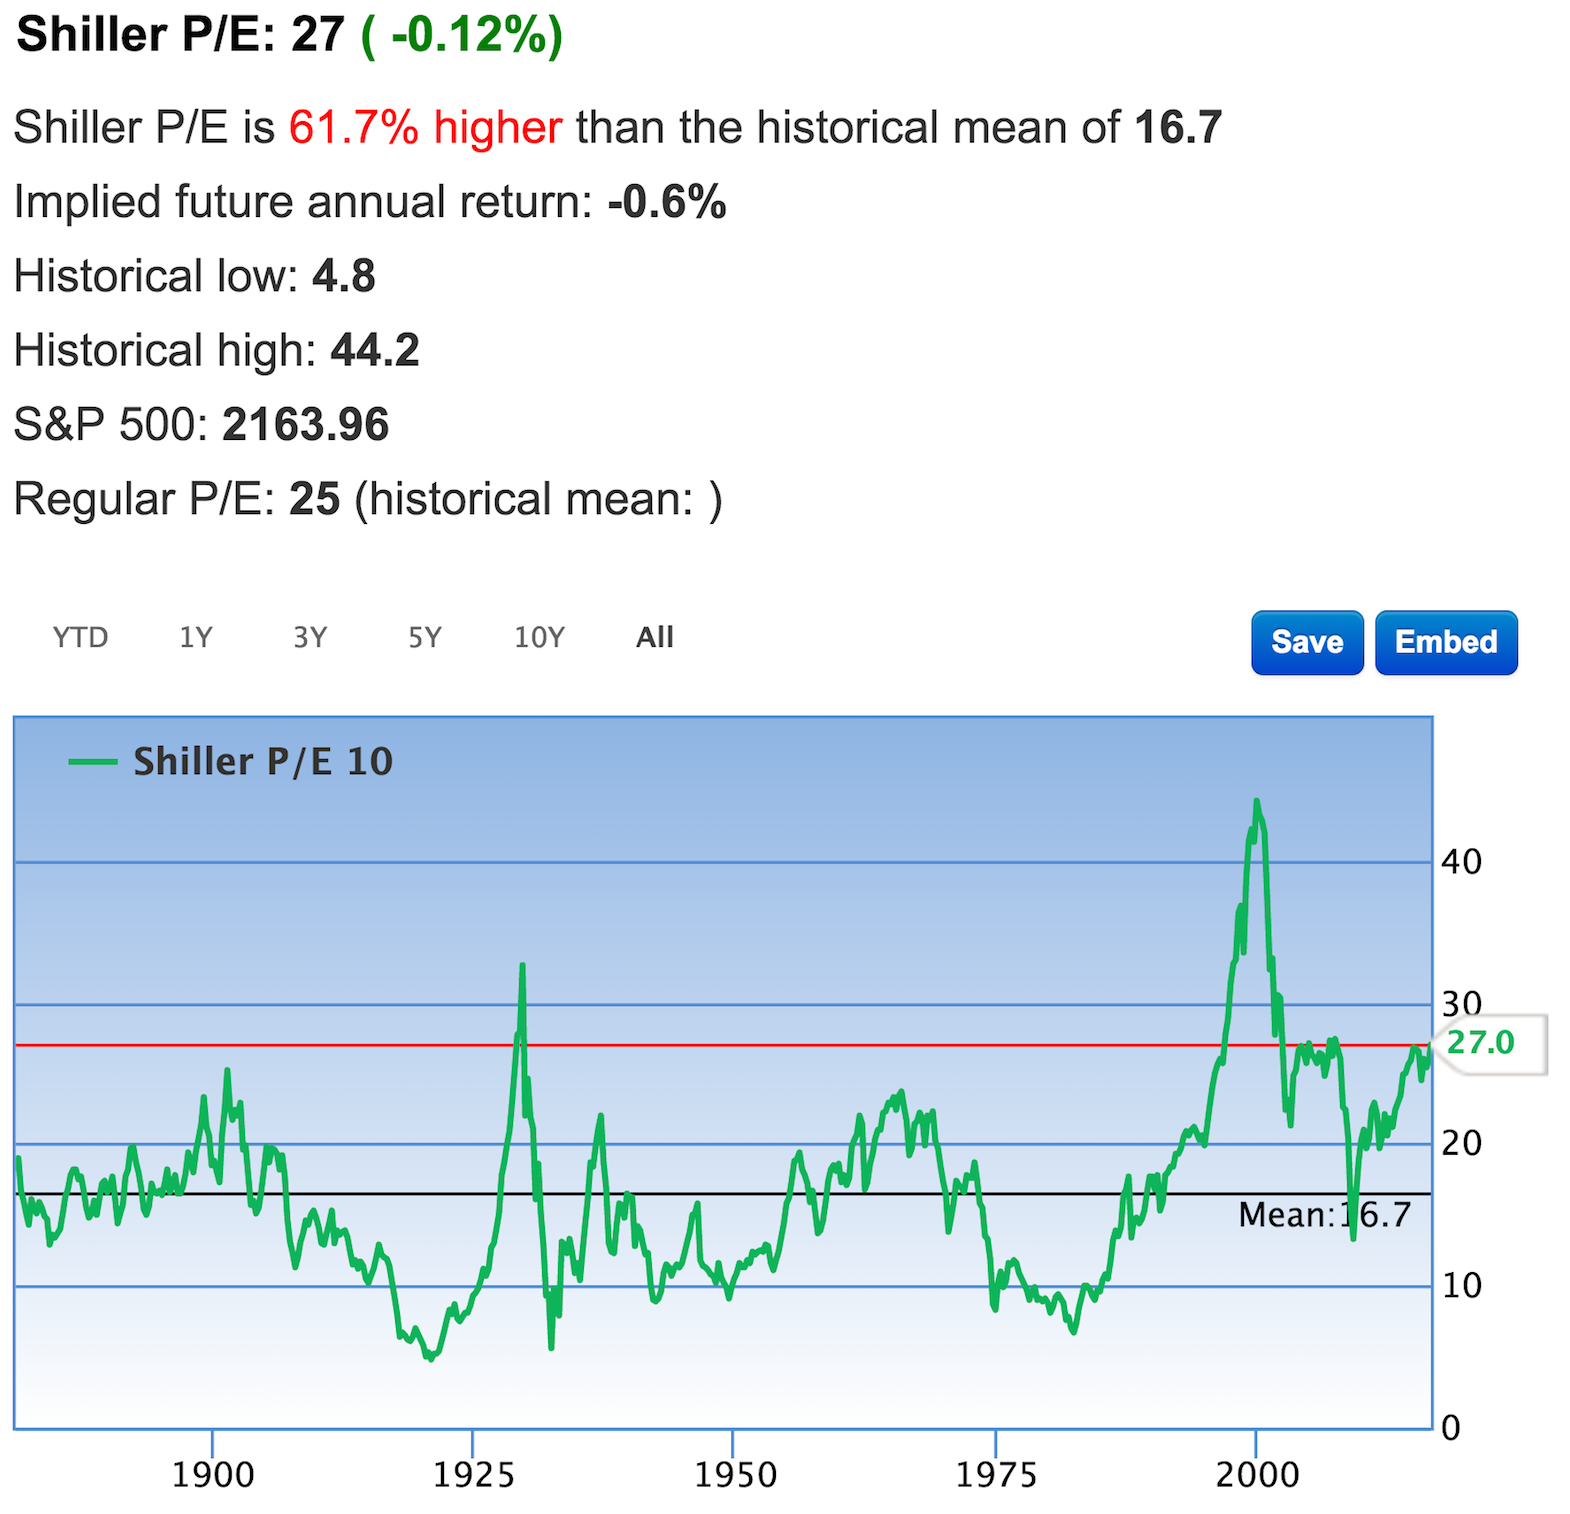
Source: Gurufocus
Graph #5: Total Market Cap to US GDP Above Pre Financial Crisis Level
Source: Gurufocus
Graph #6: Ongoing S&P 500 Earnings Recession
Source: Gurufocus
Graph #7: Asset Class Correlation to US Stocks
Source: Hedgable


